NEWSLETTER

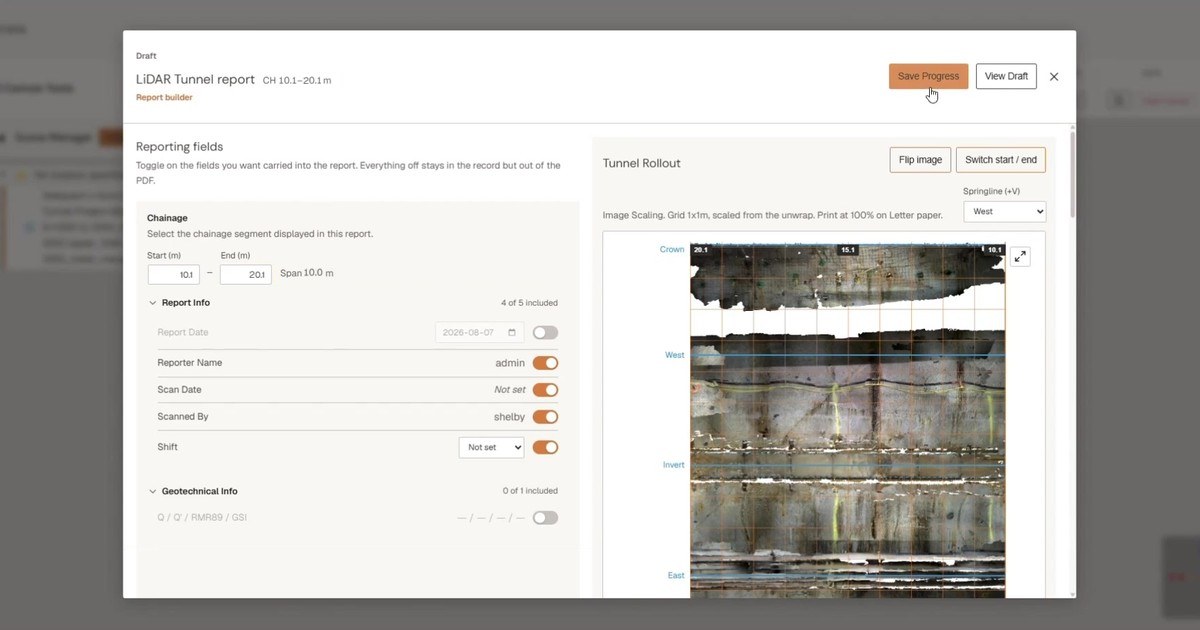

On a tunnel project, contractors and owners each hold their own account of the same section of tunnel. A tunnel profile report gives everyone one record of what was captured underground, at scale, that the team can review, measure and discuss. The report is where visualization and deliverable meet.
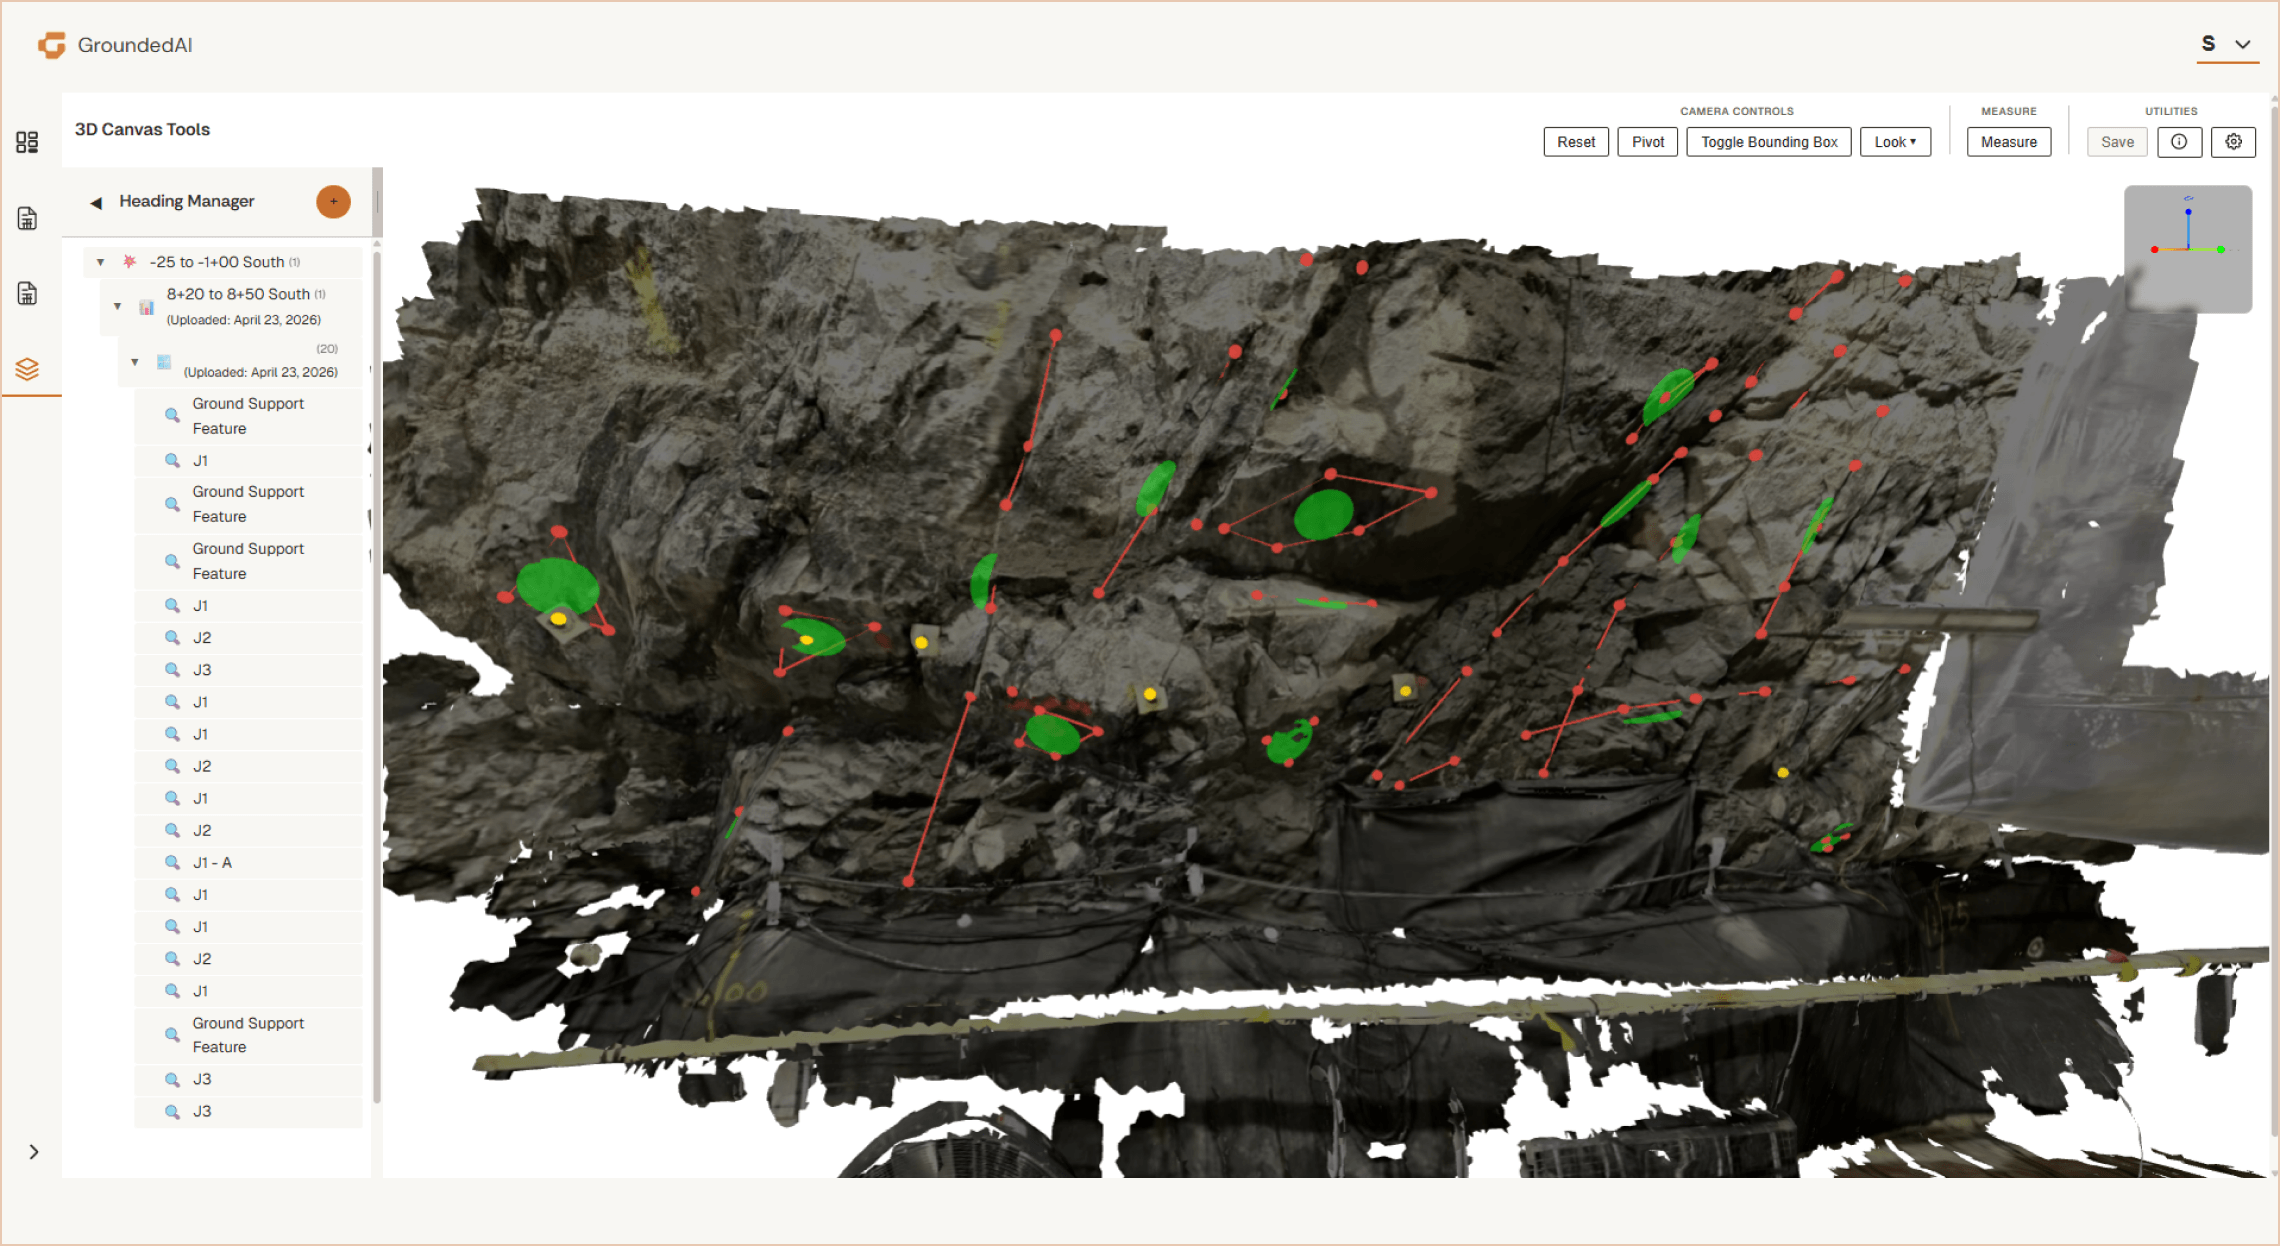
Some teams map underground with photos and pen and paper, then draw the main structures onto a rollout template by hand. That gives an interpretation of the tunnel, not a to-scale record, and no true colour view of it.
Other teams move the scan through several pieces of software to segment, unroll, export and rebuild it into a report. That takes engineering hours on every report, and registration errors often aren't caught until review.
The result: reports that are slow to produce, not to scale, and only show their errors at review.
Lithos for field capture, Strata for visualization and reporting. One workflow from the scan to the report your project issues.
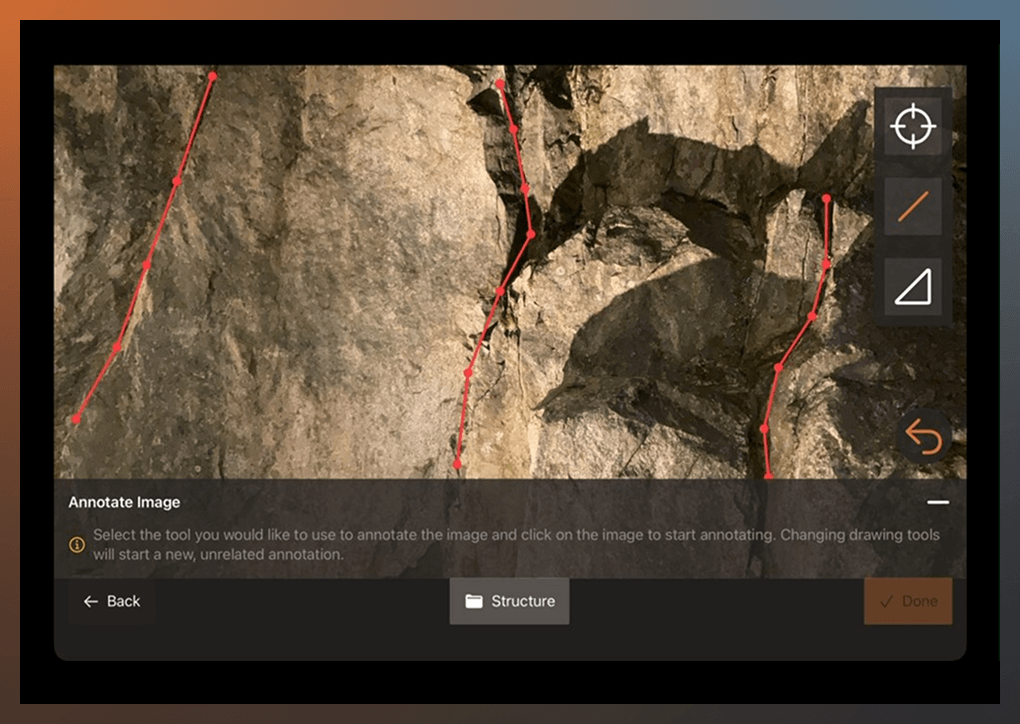
Scan the tunnel on iPad with Lithos, offline, and record observations and rock mass classifications in place. Back on Wi-Fi, one button syncs the scan to Strata.
Select the segment, align the scan to the tunnel axis and set the cylinder radius. Segment length and radius carry over between rollouts, so every report on the project is produced the same way.
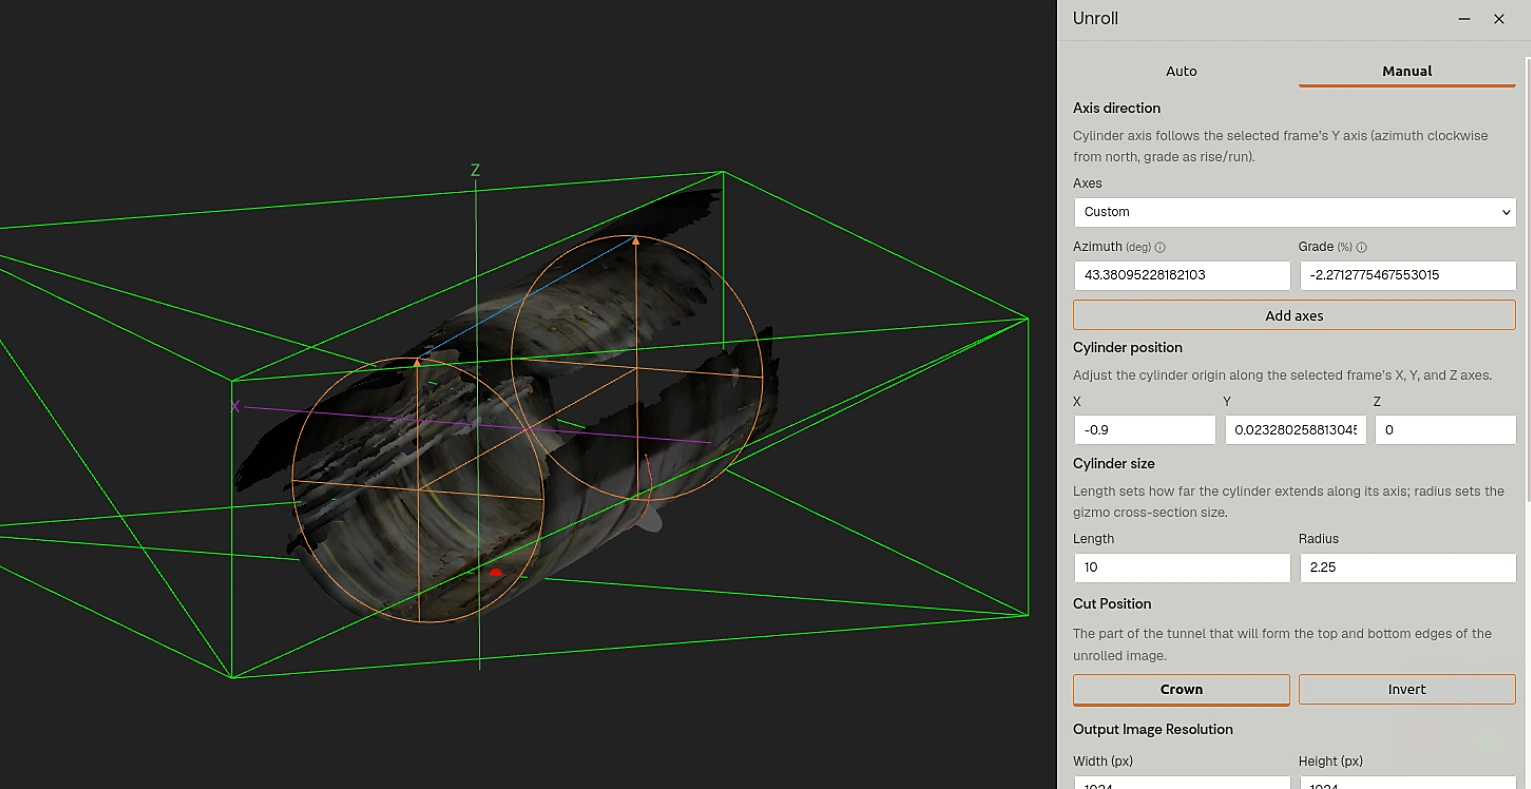
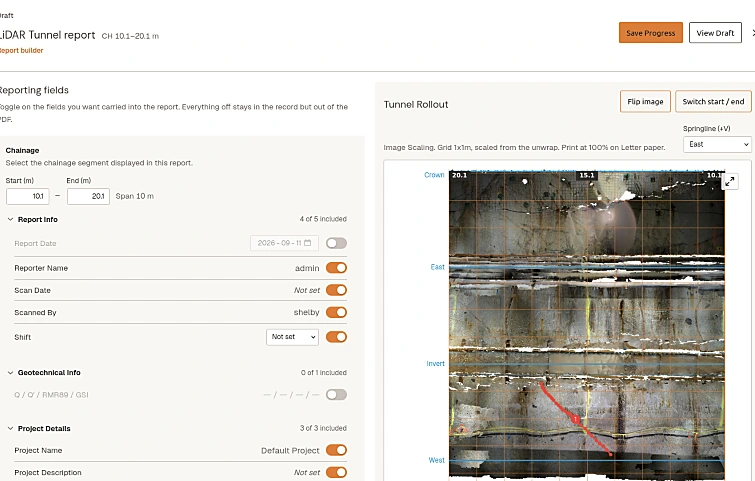
Strata develops the scan onto a plane at scale, with limited distortion, and builds the report with your headers and logo, springline labels, centre-aligned gridlines and cropping at the grid edge. Metric or imperial, output as a PDF in your project's format.

A gap found at the desk means a return trip underground. With Lithos, the crew scans the full tunnel perimeter on iPad and checks coverage and lighting before leaving, so gaps are rescanned on the spot.
Lithos works offline, and observations and rock mass classifications are recorded alongside the scan.

Strata produces the report from the same scan your team already reviews, set up to your owner's or contractor's report spec.
Your modelling software stays where it is. The same dataset exports to Leapfrog, Deswik and CAD.
Common questions about producing tunnel profile reports in Strata.


We'll walk through the scan-to-report workflow with a real tunnelling scenario.

© 2026 GroundedAI. All rights reserved.
Vancouver, BC · EN


